The Solutions view within the ACP Project is used for reviewing and comparing the solutions generated for the studies in the project. This helps users analyze and evaluate all potential solutions and choose the best one to incorporate into the Revit project.
In this view, users can:
Explore conduit layouts in the ACP 3D Model Viewer
View the solutions’ details in a table format
Graphically compare solutions based on selected criteria
This guide discusses the navigation and controls in the Solutions view.
Solutions view controls
Directly below the navigation bar, users have access to multiple viewing and filtering options:
.png)
.png) Compare button: Opens two solutions in the 3D model viewer for visual comparison.
Compare button: Opens two solutions in the 3D model viewer for visual comparison..png) Table/Chart toggle
Table/Chart toggleSolutions Table: Displays solutions in a table format.
Solutions Chart: Displays solutions in graphical format for comparing solution metrics.
.png) View Model button: Opens the 3D Solution Viewer displaying only the Background Geometry.
View Model button: Opens the 3D Solution Viewer displaying only the Background Geometry.A Study and solution may be be selected from the Solutions dropdown at the top left-corner.
Solutions table
The Solutions table displays all solutions generated from studies in the ACP project. Its columns display different metrics of the solutions which help in understanding the solutions better. Users can control what information gets displayed on the table using the different Solutions table controls.
Solutions table controls
The Solutions table presents detailed information about the generated solutions, structured across multiple data columns. This view is enabled via Table/Chart toggle.
.png)
- Search Bar: Only show solutions in the table with names matching the entered text.
- Density toggle: Enables switching between Medium and Compact size of the Projects table.
- Columns Visibility: Dropdown which enables users to control which columns of the table should be visible.
.png) Filter Studies dropdown: Allows users to refine displayed solutions based on the specific selection of studies.
Filter Studies dropdown: Allows users to refine displayed solutions based on the specific selection of studies.
To use this filter:.png)
Select the dropdown.
Select the checkbox next to the study name(s) you want to be shown in the table.
You can also Select All to include all Studies.
You can Search for studies by name.
PRO TIP: To automatically filter the Solutions list to a specific study,
From the Studies tab, open the study you want to view the solutions for.
Click on the
blue View 12 Solutions button.
Or Hover over the blue View 12 Solutions button, and click on the
green 12 Successful Solutions button.
.png)
.png) Pagination: Allows users to determine if 10, 20, 50, or 100 solutions are viewable at a time.
Pagination: Allows users to determine if 10, 20, 50, or 100 solutions are viewable at a time.
Solutions table columns
.png)
Solution
These columns provide information specifically related to the solutions for the study.
# (Solution Number): Provides a numerical reference for each solution.
Study: Displays the user-provided study name associated with the solution.
Color-coded by the specified study color for easy distinction.
Status: Shows whether the solution generation was successful.

Success: Indicates that the solution was successfully generated.A successful solution does not always mean that ACP was able to place all conduit runs. Check the Routed column (under Run IDs group) to see if any conduits are missing from the solution.

Failure : Indicates there was an error preventing that particular solution from being generated.Check errors for more information if a solution status is Failure.
Generated: Shows the timestamp for when the solution was completed.
Conduit
Displays information regarding the conduit itself.
Conduit Length: Displays the total conduit length in feet.
Bends
Shows the information specific to the bends or elbows within the solution.
°/foot: Specifies the average bend angle across all conduit runs.
Total bend angle divided by the length of all straight conduits.
QTY: The total number of bends included in the solution.
Ttl. Angle: The cumulative sum of all bend’s angles within the solution.
Run IDs
Displays information regarding elements specified in the Conduit Schedule, and Revit project to be used for routing.
Enabled: The number of Revit elements enabled and specified in the conduit schedule for the Study.
Routed: Displays the number of enabled runs which were successfully routed.
This includes a percentage based on the total number enabled and how many were successfully routed.
Estimates:
Const. Time: A rough estimate of the installation time required for the solution.
Cost Estimate: A rough estimate of the cost associated with the solution's implementation.
Estimates are not based on real-world values. These are only used to compare solutions in terms of build cost and time, not to determine actual solution implementation values.
Issues
Provides information on flagged items which may prevent the successful utilization of the generated solutions.
Warnings: Displays the number of warnings which occurred while the solutions were being generated.
Solution Warnings are generally geared for the development team and may be ignored by the user.
They indicate issues with the input data. IE: Errors in the conduit Schedule Inputs vs the data imported with Electrical Model, which must be addressed to ensure the study runs successfully.
Errors: Indicates errors preventing solution from being generated.
These are often processing errors which may need to be reported to Augmenta through support@augmenta.ai.
Actions: A list of actions that may be taken with the solution. .png)
Open: Opens the solution within the 3D Solution Viewer for the Solution.
Export to Revit (as System Conduit): Exports the Solution as system conduits into the active Revit project.
Conduit Schedule - Spreadsheet Export: DO NOT USE!
The Conduit Schedule feature is in the process of being removed. The export is static and will not update if changes are made to the model. Because some conduit solutions may require manual modifications before coordination or installation, using a static spreadsheet could cause discrepancies.
Instead, always work from the ACP Conduit Schedule created during project initialization, which remains live and updates automatically with the model.
Solutions chart
The Solutions chart presents the generated solutions as a scatterplot with solution details as variables. This view is accessed via Table/Chart toggle ![]() .
.
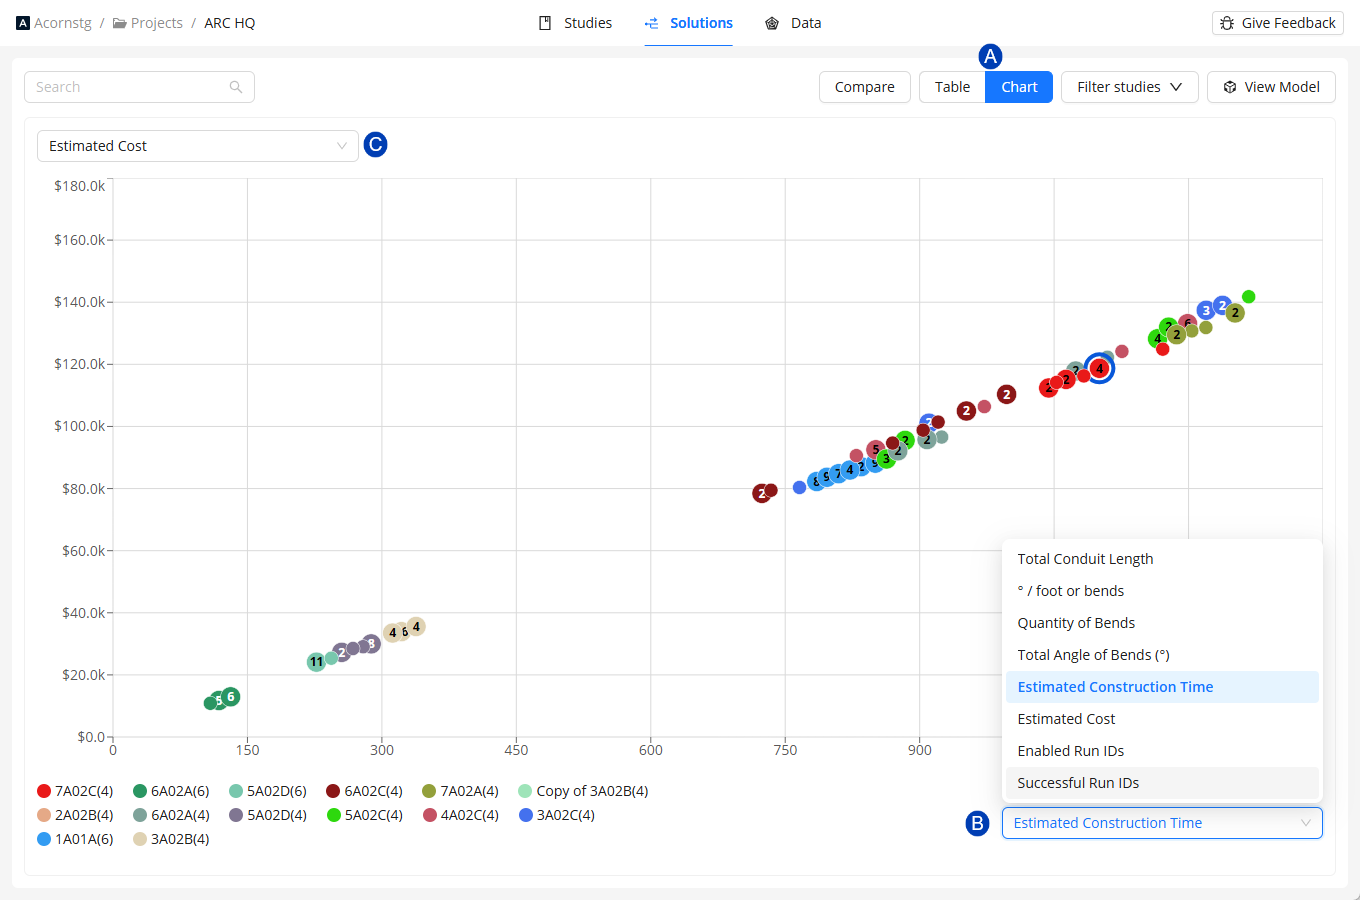
- X-Axis Dropdown: Displays solutions and their selected fields from the table along the X-axis.
- Y-Axis Dropdown: Displays solutions and their selected fields from the table along the Y-axis.
Selecting fields for the X and Y Axes
Click the drop-down of the X or Y axis.
Select the field you prefer to show in that axis.
The chart then reorganizes the data points for each solution based on the updated selection.
3D Solution Viewer
The 3D Solution Viewer in ACP allows users to visually explore each generated solution. It provides an interactive way to review conduit routing, inspect placements, and identify potential issues before export.
For a complete navigation guide of the 3D Solution Viewer, refer to the Navigating the 3D Solution Viewer article.
For step-by-step instructions on using the full range of 3D viewer features, refer to the Reviewing solutions in the 3D Viewer article.